Manual vs automated chart pattern scanning: an honest comparison
Manual chart scanning works well for small watchlists, but breaks down once you monitor more than 30-50 pairs. Automated pattern detection covers 1,000+ pairs simultaneously across multiple timeframes, runs 24/7, and applies consistent criteria without fatigue. The trade-off: automation lacks the contextual judgment that makes experienced manual traders valuable. The best workflow combines both.
If you've spent any time trading crypto, you know the feeling. You sit down with your morning coffee, open Binance or TradingView, and start flipping through charts. BTC, ETH, SOL, the majors first. Then the mid-caps. Forty minutes later, you've covered maybe 25 pairs on one timeframe. Meanwhile, a perfect ascending triangle just completed on an altcoin you didn't check.
The scale problem at a glance
Binance alone lists 1,500+ spot pairs and 600+ futures pairs. Add Bybit, KuCoin, and MEXC and you're looking at thousands of charts across multiple timeframes.
This article walks through exactly where manual scanning excels, where it falls apart, what automation actually does well, and how to combine both approaches. No sales pitch - just an honest breakdown from someone who built an automated scanner after spending years doing it manually.
The case for manual chart scanning
Manual chart scanning has real advantages that automation cannot replicate. Before discussing why traders look for alternatives, it's worth understanding what manual analysis does well.
Contextual judgment
A human trader sees more than price and volume. You notice that a double top is forming right before a Fed announcement. You recognize that the ascending triangle on SOL/USDT is happening during a broader market sell-off, which changes its probability. You remember that this particular pair has a history of false breakouts around key round numbers.
This contextual awareness is something no scanner can match. An automated system flags the pattern based on geometric criteria. A human trader evaluates whether the setup makes sense given everything else happening in the market.
Pattern quality assessment
Experienced traders develop an intuitive sense for pattern “cleanliness.” Two head and shoulders formations might both meet the technical criteria, but a seasoned chart reader can tell which one looks textbook and which one is sloppy. Bulkowski's research in the Encyclopedia of Chart Patterns demonstrates that pattern appearance matters: well-defined patterns outperform ambiguous ones across nearly every formation type.
The learning benefit
“The secret of success in the market lies not in discovering some incredible indicator or elaborate theory; rather, it lies within each individual.”
- Alexander Elder, The New Trading for a LivingThere is no substitute for the pattern recognition skills you build by manually reviewing thousands of charts. The hours spent scanning train your eye to spot formations faster, assess volume behavior instinctively, and develop an internal sense of when something “looks right.” This foundation matters regardless of whether you later adopt automated tools.
Key takeaway
Manual scanning builds irreplaceable skills: contextual judgment, pattern quality assessment, and market intuition. Every trader should spend time developing these fundamentals before relying on automation.
Where manual scanning breaks down
The problems with manual scanning are not about skill - they're about physics. There are only so many hours in a day, and the crypto market never sleeps.
The math does not work
Assume you spend an average of 2 minutes per chart doing proper multi-timeframe analysis: checking the 4-hour for structure, the 1-hour for pattern formation, and the 15-minute for entry timing. At that pace:
- 30 pairs = 1 hour of focused scanning
- 100 pairs = 3.3 hours (by which point the first charts you checked have changed)
- 1,500 pairs (Binance spot alone) = 50 hours - over two full days, non-stop
And that is one exchange on three timeframes. Add Bybit, KuCoin, and MEXC and you are looking at a mathematically impossible workload.
Cognitive fatigue and consistency
“A trader who feels upset, scared, or arrogant cannot trade well. You must be aware of your tendencies and trade to cut them short.”
- Alexander Elder, The New Trading for a LivingAfter scanning 40-50 charts, decision quality degrades. You start skipping patterns that require closer inspection. You rush through the last batch. You unconsciously favor patterns that confirm your existing bias. Research in behavioral psychology consistently shows that pattern recognition accuracy drops after extended periods of focused visual search - and chart scanning is exactly that.
The 24/7 problem
Unlike traditional stock markets with defined trading hours, crypto runs continuously. A head and shoulders pattern that starts forming during your evening session might complete its neckline break at 3 AM. A bullish flag on ETH/USDT can trigger during the Asian session while you sleep. Manual scanning means you are, at best, covering 8-12 hours of a 24-hour market.
The opportunity cost is invisible
The biggest cost of manual scanning is not the time spent - it's the patterns you never see. According to Bulkowski's research, many chart patterns (like the cup and handle, with a 61% average rise in bull markets) deliver their strongest moves in less-watched pairs. If you only scan the top 30 pairs by volume, you systematically miss the highest-reward setups.
What automated pattern detection actually does
Automated chart pattern detection is not artificial intelligence making trading decisions. It is signal processing - mathematical algorithms that identify geometric structures in price data that match predefined pattern criteria.
How it works under the hood
Modern pattern scanners use a combination of peak/trough detection, regression analysis, and validation rules. For example, detecting a double top requires: identifying two price peaks within a configurable price tolerance (typically 1-2%), verifying sufficient distance between them (not too close, not too far apart), confirming a valid neckline with bounded slope, and checking that the overall formation meets minimum duration requirements.
The technical implementation typically relies on algorithmic peak and trough detection, optimized price comparisons, and regression analysis for trendline validation. Each pattern type has its own detector with specific constants: peak similarity tolerances, minimum bar counts, slope thresholds, and breakout confirmation rules.
Take the double top as a concrete example. The detector first identifies two price peaks that fall within a tight tolerance window of each other. Then it validates a neckline between them with a bounded slope - not too steep, not too flat. It checks that the peaks are separated by enough candles to constitute a real formation, not just noise. Finally, it monitors for a neckline break with sufficient momentum. All of this runs automatically across every pair, on every candle close, on every timeframe you configure.
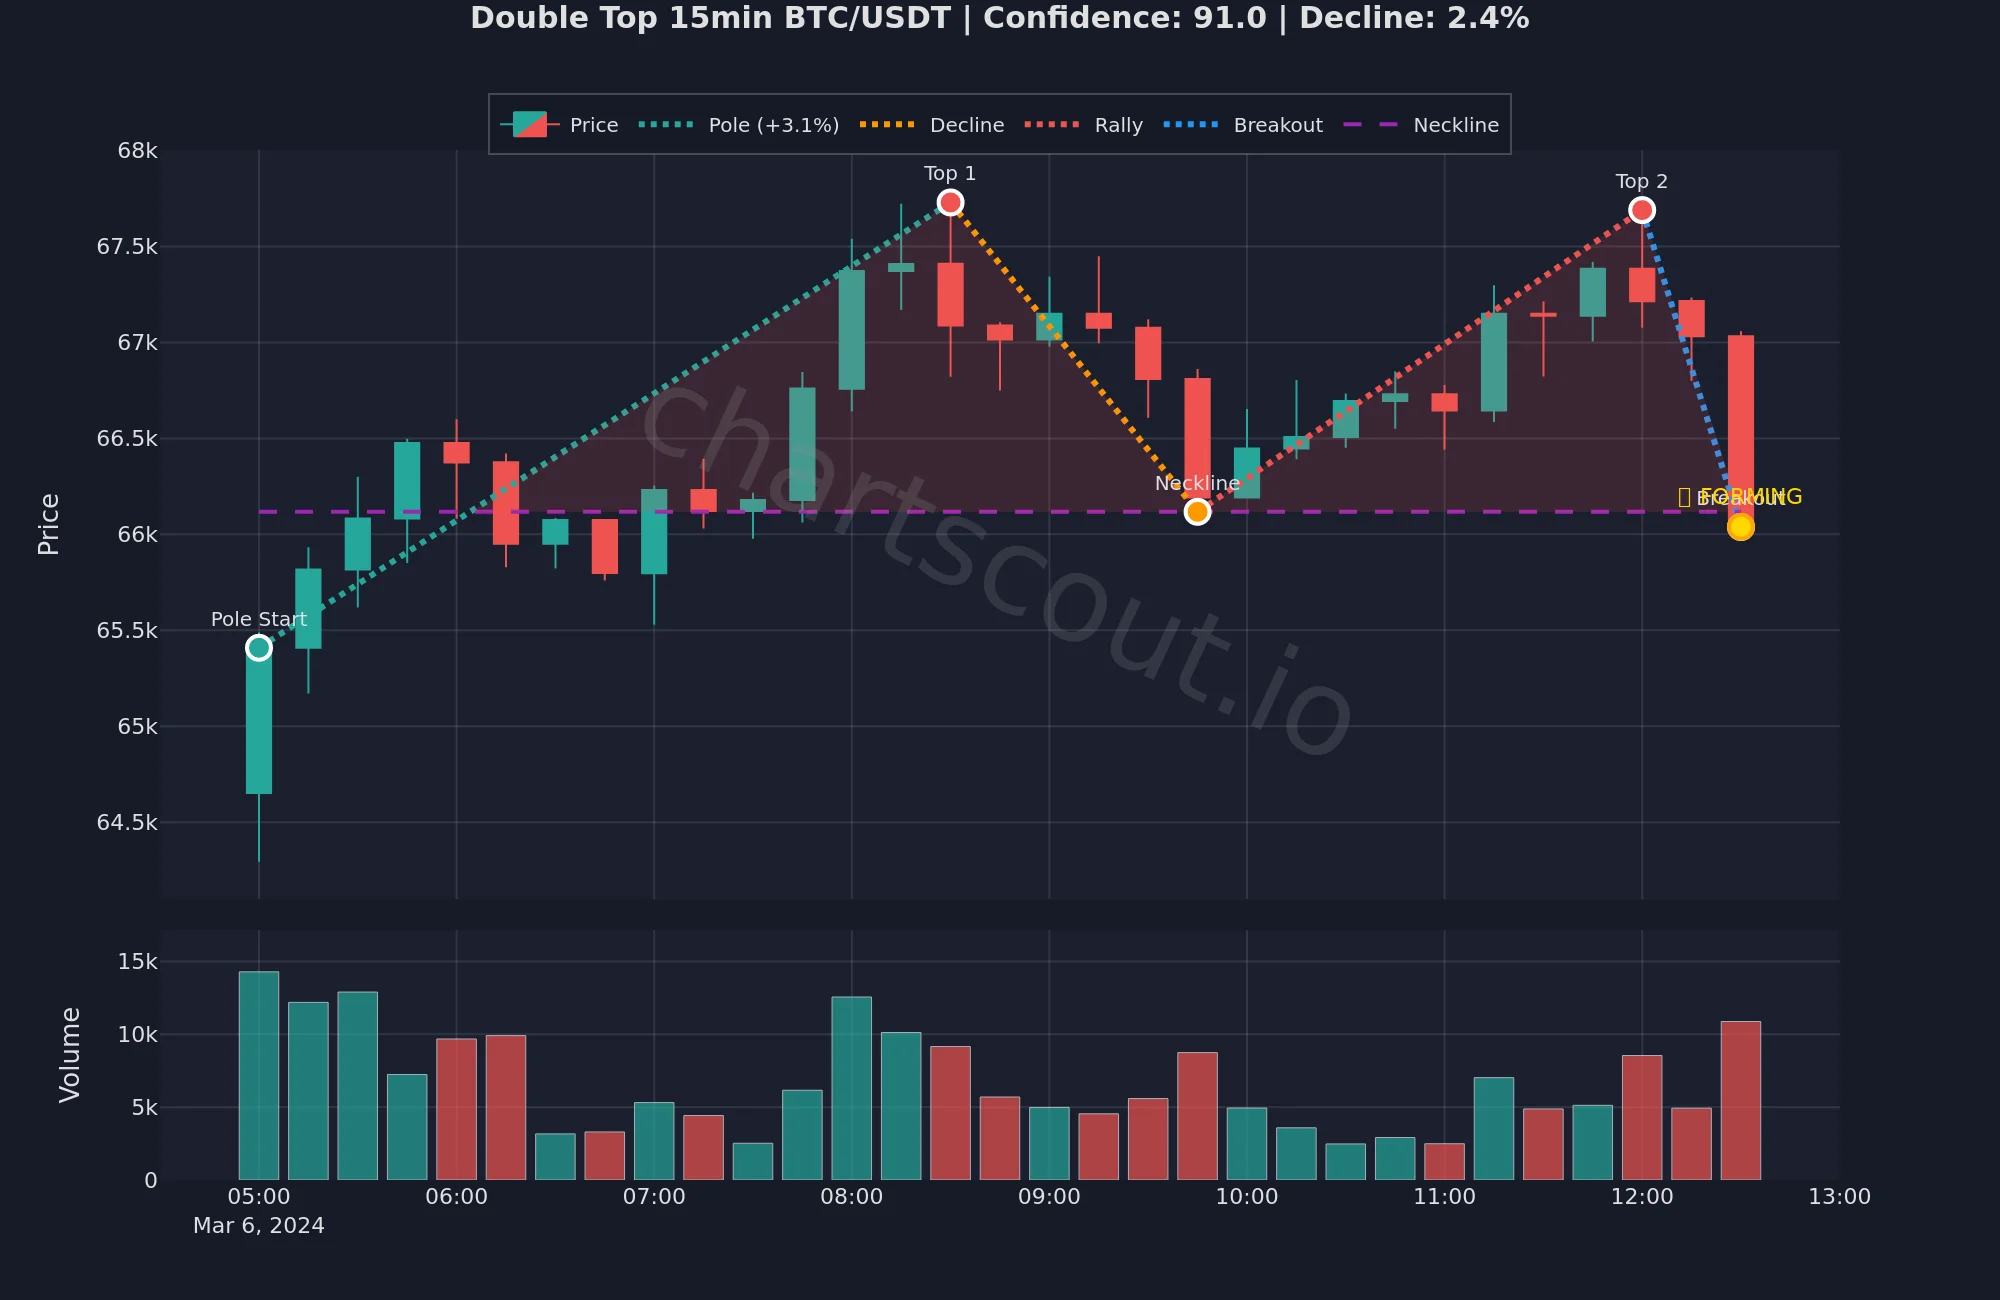
Double top detected on BTC/USDT 15m - two peaks within tolerance, neckline validated, breakout confirmed automatically.
What automated scanners excel at
Speed
A scanner can analyze a 300-candle dataset for pattern formations in milliseconds. Running across 1,000+ pairs on every candle close, it processes what would take a human trader days in seconds.
Consistency
The 500th pattern evaluated uses exactly the same criteria as the first. No fatigue, no bias, no skipped charts. Every pair gets the same analytical rigor.
Continuous operation
Runs 24/7/365 without breaks. Catches the 3 AM breakout, the Sunday consolidation, and the holiday pump that manual traders sleep through.
Multi-pattern coverage
Scans for 20+ pattern types simultaneously on every pair. A manual trader checking for double tops might overlook the cup and handle forming on the same chart.
This is how ChartScout approaches detection. Each pattern type - from double tops to cup and handles to head and shoulders - runs as an independent detector process. Candle data streams through a real-time buffer, and each detector reads from it instantly. When a detector confirms a valid formation, the alert fires within seconds. The detection logic uses algorithmic peak-finding for identifying local extrema and optimized validation of price tolerances, neckline slopes, and formation geometry.
The honest limits of automation
Automated scanning is powerful, but pretending it has no downsides would be dishonest. Here are the real limitations.
No contextual awareness
A scanner does not know that the SEC just filed a lawsuit against a project, that a major exchange is about to delist a token, or that the entire market is in a liquidity crisis. It identifies patterns based purely on price geometry. A technically valid bearish flag means nothing if a positive catalyst is about to drive the price up 30%.
False positives are inevitable
Every pattern has a failure rate. According to Bulkowski's research, even high-reliability patterns like head and shoulders carry a 19% failure rate after the neckline breaks. Automated scanners flag patterns at formation - before confirmation - which means the raw signal-to-noise ratio can be challenging. Effective systems filter aggressively (minimum formation duration, volume thresholds, breakout confirmation), but some false positives will always get through.
Subjective patterns remain difficult
Patterns with more subjective criteria - harmonic patterns, Elliott Wave counts, complex Wyckoff accumulation structures - resist reliable automation. Classical geometric patterns (triangles, wedges, channels, double tops, flags) lend themselves well to algorithmic detection because they have clear mathematical definitions. The more subjective the pattern, the less suitable it is for automation.
Automation is not a trading system
A scanner tells you where to look, not what to do. The detection output is the beginning of your analysis, not the end. Position sizing, entry timing, stop-loss placement, and risk management still require human judgment. Treat automated alerts as a filtered watchlist, not as trade signals.
Head-to-head comparison
Here is a direct comparison across the dimensions that matter most to active crypto traders.
| Dimension | Manual Scanning | Automated Scanning |
|---|---|---|
| Coverage | 20-40 pairs per session | 1,000+ pairs continuously |
| Speed | 2-3 min per chart | Milliseconds per chart |
| Uptime | 8-12 hours/day | 24/7/365 |
| Consistency | Degrades with fatigue | Identical every time |
| Context | Excellent - news, sentiment, macro | None - price geometry only |
| Pattern Quality | Subjective quality judgment | Rules-based filtering |
| Multi-Pattern | 1-2 patterns at a time | 20+ patterns simultaneously |
| Learning Value | Builds chart-reading skills | Minimal skill development |
| Cost | Your time (most expensive) | Subscription fee |
Neither column wins outright. Manual scanning dominates on context and quality judgment. Automated scanning dominates on coverage, speed, and consistency. The winner depends on your trading style, the size of your universe, and how many hours you want to spend staring at charts instead of analyzing setups and managing trades.
The scale problem: why 1,000+ pairs changes everything
The decision between manual and automated scanning often comes down to one question: how many pairs do you want to monitor?
Small watchlist (under 30 pairs)
If you trade only Bitcoin, Ethereum, and a handful of large-cap altcoins, manual scanning is viable and arguably preferable. You know these charts intimately. You recognize their behavior around key levels. Your contextual knowledge of each asset adds real value to every pattern you identify. Automation here is a convenience, not a necessity.
Medium watchlist (30-100 pairs)
This is the gray zone. You can technically scan this many charts, but it takes 1-2 hours of focused work and you will not catch every formation. Missing patterns becomes more frequent. Fatigue-related mistakes creep in at the tail end of your scanning session. This is typically where traders first start looking for automated tools to supplement their workflow.
Large universe (100+ pairs)
Manual scanning at this scale is not just difficult - it is counterproductive. The time spent scanning crowds out the time available for actual trade analysis, execution, and management. You end up doing the lowest-value activity (finding patterns) at the expense of the highest-value activity (trading them well).
“A good trading system gives you an edge over the long haul, but no system can make you rich if your risk management is poor.”
- Alexander Elder, The New Trading for a LivingElder's point applies directly here: the highest leverage activity for a trader is not pattern discovery - it is decision-making and risk management. If you are spending three hours a day scanning charts, those are three hours not spent on trade planning, position management, and reviewing your results.
The real question
It is not “Is manual or automated better?” It is “Is scanning the best use of my limited trading time?” For most active traders monitoring more than a small watchlist, the answer is no.
The hybrid workflow: combining both approaches
The most effective approach is not an either/or choice. It is a pipeline: automated detection for discovery, human judgment for validation.
Stage 1: automated discovery
Let the scanner do what it does best: monitor every pair, every timeframe, every candle close. When a pattern meets the minimum criteria (formation duration, price tolerance, trendline slope), it fires an alert. This stage replaces hours of manual chart flipping with a continuously updated filtered watchlist.
Stage 2: human validation
You review the scanner's output. Open each flagged chart and apply your contextual judgment: Does the pattern look clean? Is volume confirming? What is the broader market doing? Are there fundamental catalysts that could override the technical setup? This is where your manual chart-reading skills provide irreplaceable value.
Stage 3: trade execution
For patterns that pass your human filter, you plan the trade: entry point, stop-loss placement, target calculation, position size. This is pure human decision-making - the part that actually determines whether you make money.
This three-stage pipeline is exactly why ChartScout exists. The system handles stage one - scanning 1,000+ pairs across Binance, Bybit, KuCoin, MEXC, and Hyperliquid for 20+ pattern types including double tops, head and shoulders, triangles, wedges, flags, cup and handles, and channels. Each detector runs independently, processing real-time candle data and using algorithmic analysis to identify valid formations. When a pattern passes all validation checks, the alert reaches you in seconds through Telegram, Discord, or email. Stages two and three remain yours.
Do not skip the validation step
The most common mistake traders make with automated scanners is treating every alert as a trade signal. The scanner outputs candidates, not recommendations. Your validation step is what converts raw detection into tradeable setups with positive expectancy.
How to transition from manual to automated scanning
If you are considering adding automation to your workflow, do not switch overnight. A gradual transition builds confidence and helps you calibrate the scanner's output against your own judgment.
Six steps to a hybrid workflow
Audit your current scanning workflow
Document how many pairs you scan, which timeframes you check, how long each session takes, and which patterns you look for. Most traders discover they cover fewer than 30 pairs per session.
Identify your coverage gaps
List the pairs and timeframes you skip due to time constraints. Calculate the percentage of the market you actually monitor versus the total available trading pairs on your exchanges.
Define your pattern criteria
Write down the exact rules you use to validate each pattern: minimum formation duration, volume requirements, breakout confirmation thresholds. This forces precision that translates directly to automated filters.
Set up automated scanning
Configure an automated scanner to monitor your target patterns across all relevant pairs and timeframes. Use the criteria from step 3 as your filter parameters.
Run both methods in parallel
Continue manual scanning alongside the automated tool for at least two weeks. Compare which patterns each method catches, misses, and flags as false positives. This builds trust in the automated system.
Shift manual time to trade analysis
Once confident in the scanner's output, redirect the hours previously spent scanning charts toward analyzing flagged patterns, refining entry timing, and managing open positions.
Frequently asked questions
Is automated chart pattern scanning more accurate than manual scanning?
Automated scanning is more consistent but not inherently more accurate. It applies the same mathematical criteria every time without fatigue or bias. Manual analysis excels at reading context that algorithms miss, such as news events or unusual market structure. The best approach combines automated detection for coverage with manual validation for context.
How many crypto pairs can a manual trader realistically scan per day?
Most traders can thoroughly scan 20-40 pairs across 2-3 timeframes in a focused session of 1-2 hours. At 2-3 minutes per chart with proper multi-timeframe analysis, scanning 50 pairs takes over two hours. Exchanges like Binance list 600+ pairs, meaning manual traders cover less than 7% of available opportunities.
Can automated scanners detect all chart pattern types?
Modern scanners can detect most classical chart patterns including triangles, wedges, head and shoulders, double tops and bottoms, flags, pennants, cup and handle, and channels. More subjective patterns like Elliott Wave counts or harmonic patterns remain difficult to automate reliably. ChartScout detects 20+ pattern types using algorithmic analysis and mathematical validation.
Will I lose my chart-reading skills if I switch to automated scanning?
No. Automated scanning replaces the discovery phase, not the analysis phase. You still review every flagged pattern, confirm the setup, plan entries and exits, and manage the trade. Many traders report that reviewing scanner output actually improves their pattern recognition over time because they see more examples across more markets.
What is the biggest advantage of manual chart pattern scanning?
The biggest advantage is contextual judgment. A human trader can factor in news events, recognize unusual market conditions, assess overall market sentiment, and weigh pattern quality subjectively. Automated scanners apply fixed rules regardless of context. This is why the optimal workflow uses automation for discovery and human judgment for validation.
How does automated scanning handle the 24/7 crypto market?
Automated scanners run continuously without breaks, monitoring every candle close across all configured pairs and timeframes. This is a critical advantage in crypto where patterns can form and break out at any hour. Manual traders are limited to their waking hours, missing overnight setups that often occur during Asian or European session overlaps.
Do professional traders use automated pattern scanners?
Yes. Professional and institutional traders have used automated screening tools for decades. As Alexander Elder notes in The New Trading for a Living, successful traders focus their energy on decision-making rather than data gathering. Automated scanning handles the repetitive discovery work, freeing professionals to focus on trade selection and risk management.
Conclusion: choose your approach based on scale
Manual chart scanning is valuable, educational, and effective - for small watchlists. Once your trading universe expands beyond 30-50 pairs, the math stops working. You cannot scan 600+ charts across multiple timeframes without sacrificing either coverage or quality. Automation solves the coverage problem while preserving your time for the work that actually drives returns: trade analysis, risk management, and execution.
The decision is not about replacing your skills. It is about deploying them more effectively. Use automation for the grunt work of pattern discovery. Apply your hard-earned judgment to the patterns it surfaces. This is how you cover more market in less time without losing the analytical edge that comes from years of reading charts. For a deeper look at how real-time alerts change your trading workflow, see our guide on alert-driven trading.
Ready to scan smarter, not harder?
ChartScout scans 1,000+ crypto pairs for 20 pattern types in real-time. Start a free 7-day trial.
Start 7-Day TrialSet up your first pattern watcher in under 2 minutes. No credit card required.
Sources & references
- Bulkowski, Thomas N. Encyclopedia of Chart Patterns, 2nd Edition. John Wiley & Sons, 2005. ISBN: 978-0471668268.
Comprehensive statistical analysis of chart pattern performance, failure rates, and measured move targets across thousands of trades. - Murphy, John J. Technical Analysis of the Financial Markets. New York Institute of Finance, 1999. ISBN: 978-0735200661.
Foundational reference for chart pattern identification, classification, and trading methodology. - Elder, Alexander. The New Trading for a Living. John Wiley & Sons, 2014. ISBN: 978-1118443927.
Trading psychology, risk management principles, and the importance of systematic approaches to market analysis.
Related guides
Alert-driven trading
How real-time pattern alerts replace screen-watching and improve your trading consistency.
How to read crypto charts
From candlestick basics to advanced technical analysis - everything you need to read crypto charts.
Chart patterns & volume analysis
Master volume confirmation across every major chart pattern - the #1 signal for valid breakouts.
How to spot fake breakouts
Learn to identify fakeouts with a 7-point verification checklist, probability tables, and real case studies.
Head and shoulders pattern guide
81% success rate - complete guide with Bulkowski statistics and crypto-specific entry strategies.
Double top pattern guide
Master the double top reversal pattern with statistical data, entry rules, and real crypto examples.

Stjepan Ivanović
Founder of ChartScout · Crypto Trader Since 2013
Trading crypto since 2013 with his first Bitcoin bought at ~$200. Four complete bull/bear market cycles, traded on early exchanges like Mt.Gox and BTC-e, on-chain trading on IDEX and EtherDelta, and ~70 crypto project investments. Built ChartScout after 20+ months of development to automate what no trader can do manually. Watch hundreds of charts 24/7.